Source code for mnist
import pickle as pkl
import numpy as np
import matplotlib.pyplot as plt
from mlp import MLP
[docs]def show_example_image(data: np.array, label: np.array, true_labels: dict) -> None:
"""
Prints first image of given data
:param data: images
:type data: np.array
:param label: labels of images
:type label: np.array
:param true_labels: dictionary with names of labels
:type true_labels: dict
:return: None
:rtype: None
"""
first_image = data[0]
first_image = np.reshape(first_image, (36, 36))
plt.imshow(first_image)
plt.show()
print(true_labels[label[0]])
[docs]def get_train_and_test() -> tuple:
"""
Function for load dataset from pickle file and return test and train set
:return: tuple of np.arrays
:rtype: tuple
"""
with open("train.pkl", 'rb') as pickleFile:
pkl_file = pkl.load(pickleFile)
data = pkl_file[0]
labels = pkl_file[1]
indices = np.arange(data.shape[0])
np.random.shuffle(indices)
data = data[indices]
labels = labels[indices]
data_train = data[0:int(0.8 * data.shape[0])]
labels_train = labels[0:int(0.8 * data.shape[0])]
data_test = data[int(0.8 * data.shape[0]):]
labels_test = labels[int(0.8 * data.shape[0]):]
return data_train, labels_train, data_test, labels_test
[docs]def get_dict_labels() -> dict:
"""
:return: dictionary with name of labels in mnist dataset
:rtype: dict
"""
list_of_keys = list(range(10))
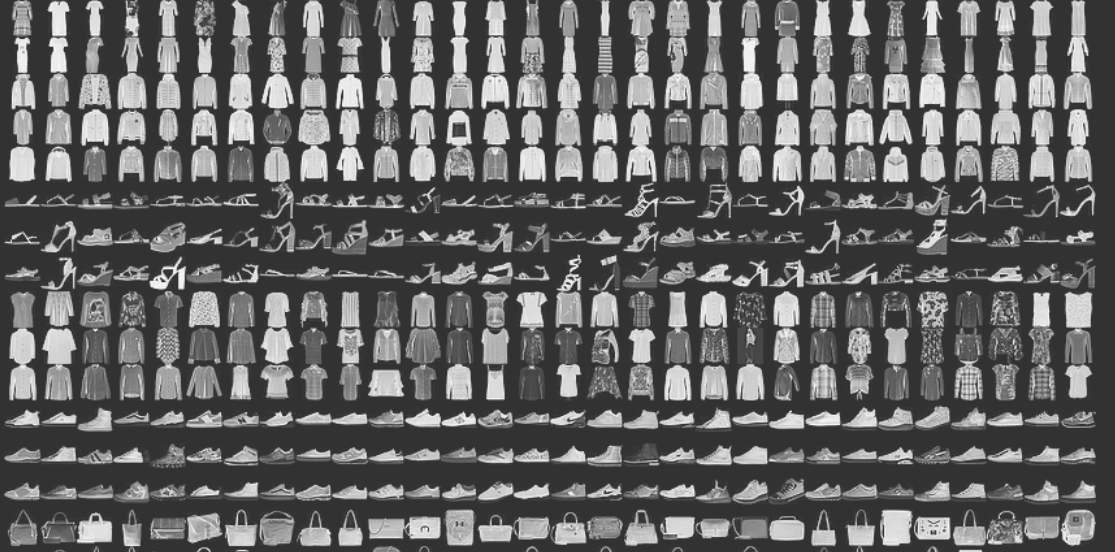
list_of_values = ['T-shirt/top', 'Trouser', 'Pullover', 'Dress', 'Coat',
'Sandal', 'Shirt', 'Sneaker', 'Bag', 'Ankle boot']
true_labels = dict(zip(list_of_keys, list_of_values))
return true_labels
[docs]def main():
"""
.. todo::
* TODO: Make stratified train/test split
* TODO: Stochastic gradien descent and mini batch
* TODO: Adam solver
* TODO: Learning rate change during training
"""
name_of_labels = get_dict_labels()
train_data, train_labels, test_data, test_labels = get_train_and_test()
show_example_image(train_data, train_labels, name_of_labels)
mlp = MLP(verbose=False, restore=True)
params_values, cost_history, accuracy_history = mlp.train(np.transpose(train_data), train_labels,
epochs=100, learning_rate=0.03)
plt.plot(accuracy_history)
plt.ylabel('acc')
plt.xlabel('epochs')
plt.show()
plt.plot(cost_history)
plt.ylabel('loss')
plt.xlabel('epochs')
plt.show()
acc = mlp.test(np.transpose(test_data), test_labels)
print(acc)
if __name__ == "__main__":
main()